Cell–cell communication with sceleto.interaction
sceleto.interaction infers ligand–receptor–mediated signaling between cell groups from single-cell data. It is a Python port of CellChat (Jin et al., Nat. Commun. 2021) built directly on AnnData, reproducing CellChat’s core numerics — communication probabilities, permutation p-values, pathway aggregation, network centrality, and communication-pattern (NMF) decomposition — with the CellChatDB (human/mouse/zebrafish) bundled, so no R runtime is required.
This tutorial follows the official CellChat vignette so results can be compared against the R original.
Attribution / license. This module is a port of CellChat (GPL-3.0). Please cite Jin et al., Nat. Commun. 2021 when using it. The bundled CellChatDB and the algorithm are derived from that work.
Data
We use the CellChat human-skin dataset (scRNA-seq of skin from patients with atopic dermatitis; figshare 24470719, file data_humanSkin.rda). As in the CellChat single-dataset vignette we keep the lesional (LS) cells only — 5,011 cells across 12 cell groups, log-normalized.
The .rda is an R object; convert it to AnnData once (in R):
library(Matrix)
load("data_humanSkin.rda")                 # -> data_humanSkin$data (genes x cells), $meta
use  <- rownames(data_humanSkin$meta)[data_humanSkin$meta$condition == "LS"]
writeMM(data_humanSkin$data[, use], "matrix.mtx")
writeLines(rownames(data_humanSkin$data), "genes.txt")
writeLines(use, "barcodes.txt")
write.csv(data_humanSkin$meta[use, ], "meta.csv")
then build humanSkin_LS.h5ad from matrix.mtx + meta.csv (cells × genes, obs["labels"] holds the cell-group column). The rest of this tutorial reads that file.
[1]:
import scanpy as sc
import matplotlib.pyplot as plt
import sceleto.interaction as ix

sc.settings.verbosity = 0
[2]:
adata = sc.read_h5ad("humanSkin_LS.h5ad")
adata.obs["labels"] = adata.obs["labels"].astype("category")
print(adata)
adata.obs["labels"].value_counts()
AnnData object with n_obs × n_vars = 5011 × 17328
    obs: 'patient.id', 'condition', 'labels'
[2]:
labels
APOE+ FIB       1228
FBN1+ FIB        813
TC               765
CD40LG+ TC       630
Inflam. FIB      484
cDC2             294
Inflam. TC       266
COL11A1+ FIB     181
cDC1             121
Inflam. DC        81
NKT               81
LC                67
Name: count, dtype: int64
1. Build the CellComm object and infer communication
The pipeline mirrors CellChat’s workflow and is chainable (each step returns self):
identify_overexpressed()— over-expressed genes → significant ligand–receptor pairscompute_communication()— LR-level probability + permutation p-values (parallel overn_jobs)compute_communication_pathway()— collapse LR pairs into signaling pathwaysaggregate()— cell-group × cell-group aggregated network (weight & count)
[3]:
cc = ix.CellComm(adata, groupby="labels", species="human")
cc.identify_overexpressed()
cc.compute_communication(nboot=100, n_jobs=8, seed=1)
cc.compute_communication_pathway()
cc.aggregate()

print("cell groups :", list(cc.group_names))
print("LR pairs    :", len(cc.LRsig))
print("pathways    :", len(cc.netP["pathways"]))
[interaction] normalized 539 gene symbols onto CellChatDB canonical symbols (alias/case)
[interaction] 950 over-expressed genes → 1650 significant L-R pairs
[interaction] communication inference done: 1650 pairs, 12 groups
[interaction] 33 signaling pathways (172 with no significant communication dropped)
cell groups : ['APOE+ FIB', 'CD40LG+ TC', 'COL11A1+ FIB', 'FBN1+ FIB', 'Inflam. DC', 'Inflam. FIB', 'Inflam. TC', 'LC', 'NKT', 'TC', 'cDC1', 'cDC2']
LR pairs    : 1650
pathways    : 33
2. The aggregated cell–cell communication network
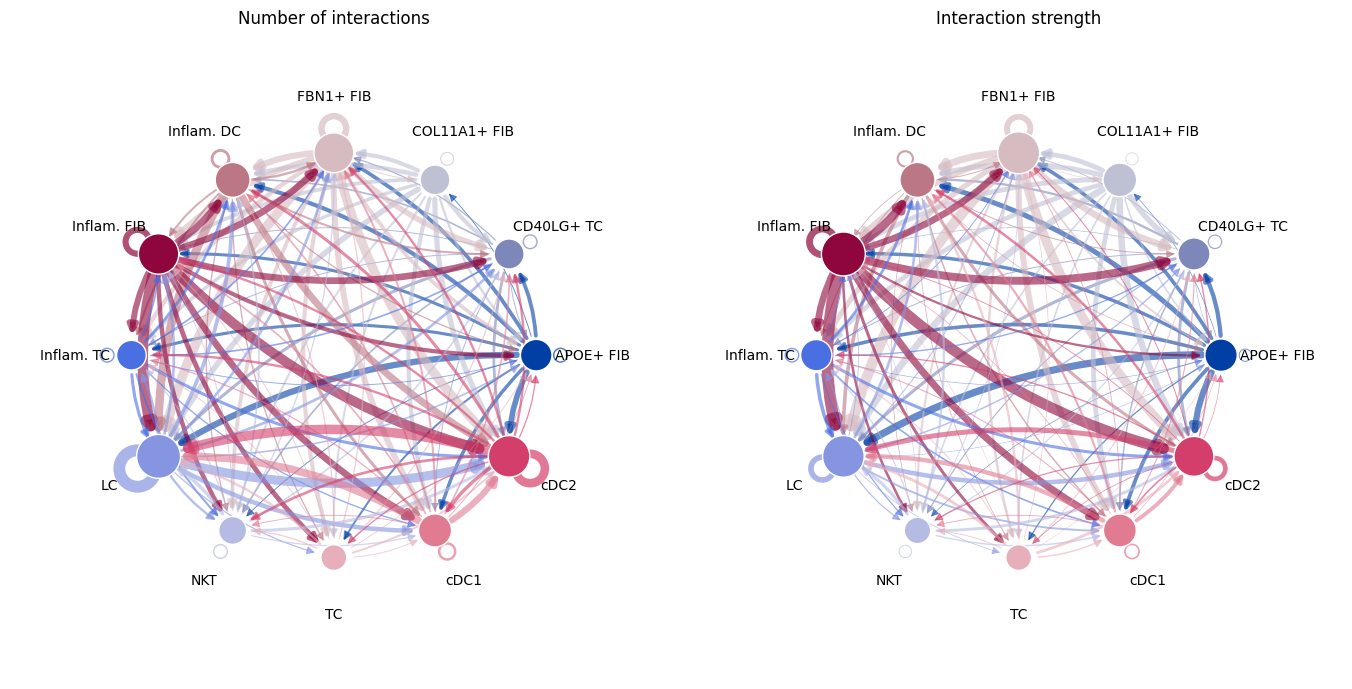
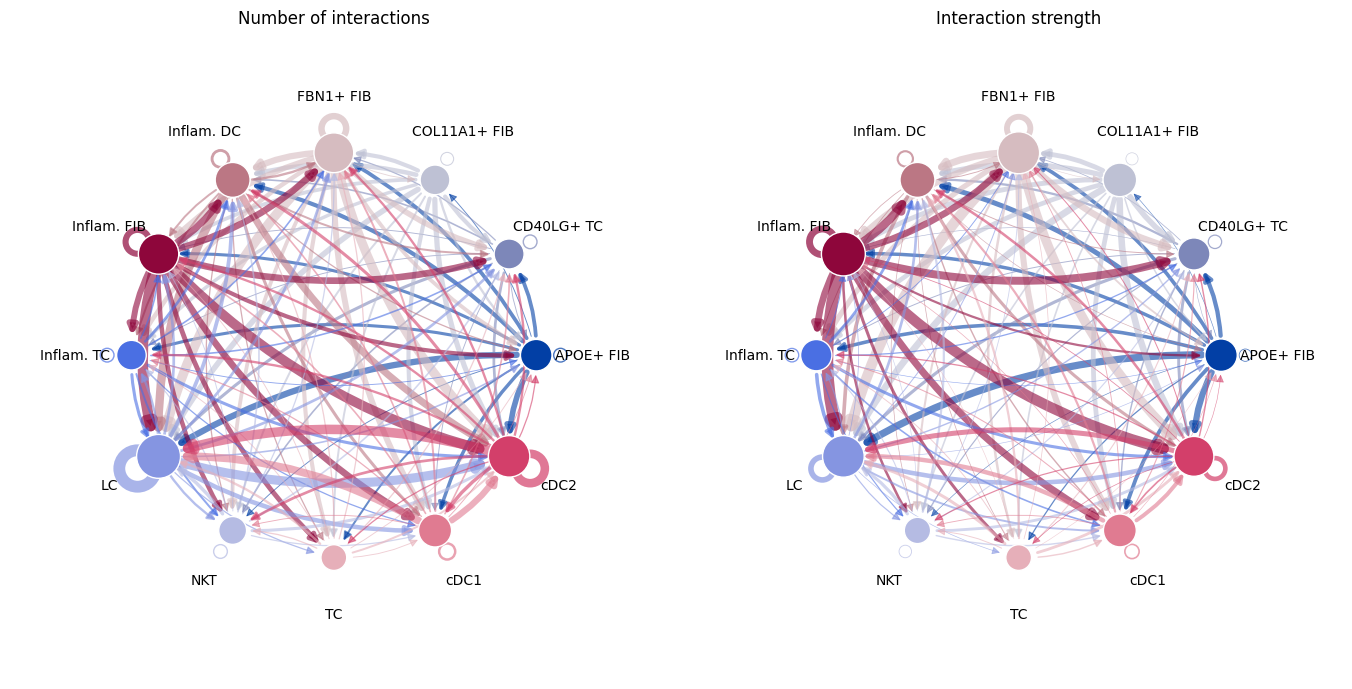
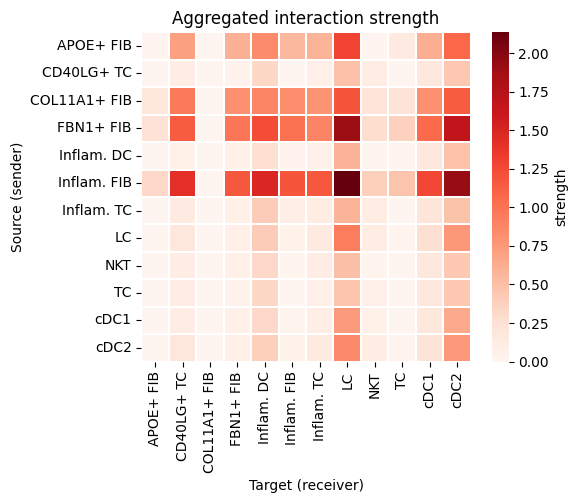
cc.weight (interaction strength) and cc.count (number of significant LR links) are group × group matrices. Visualize them as a circular network and a heatmap.
[4]:
fig, axes = plt.subplots(1, 2, figsize=(14, 7))
ix.plot_network_circle(cc.count,  cc.group_names, ax=axes[0], title="Number of interactions")
ix.plot_network_circle(cc.weight, cc.group_names, ax=axes[1], title="Interaction strength")
fig
[4]:
[5]:
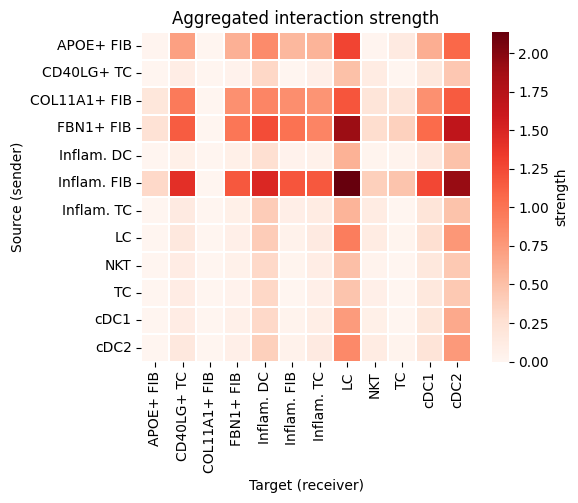
ix.plot_heatmap(cc.weight, cc.group_names, title="Aggregated interaction strength")
[5]:
3. Rank signaling pathways by information flow
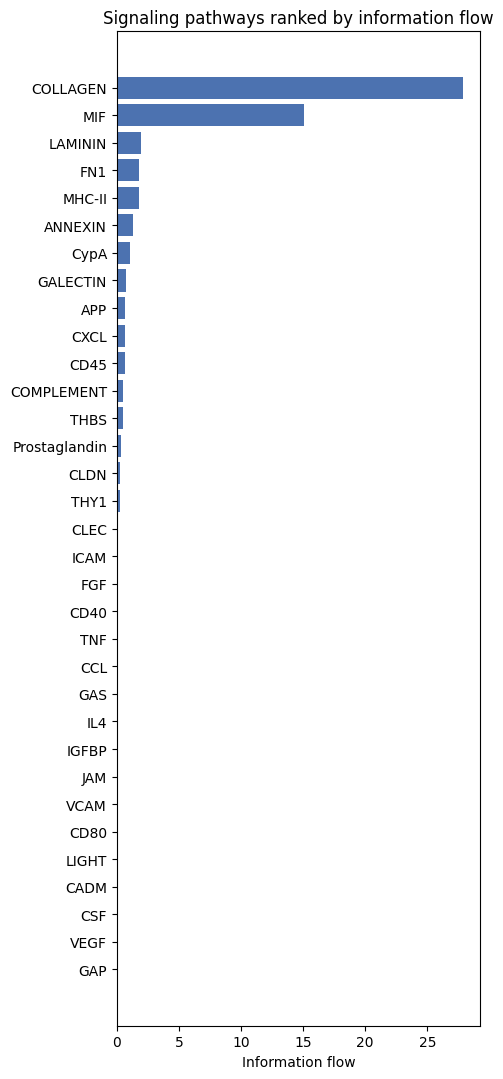
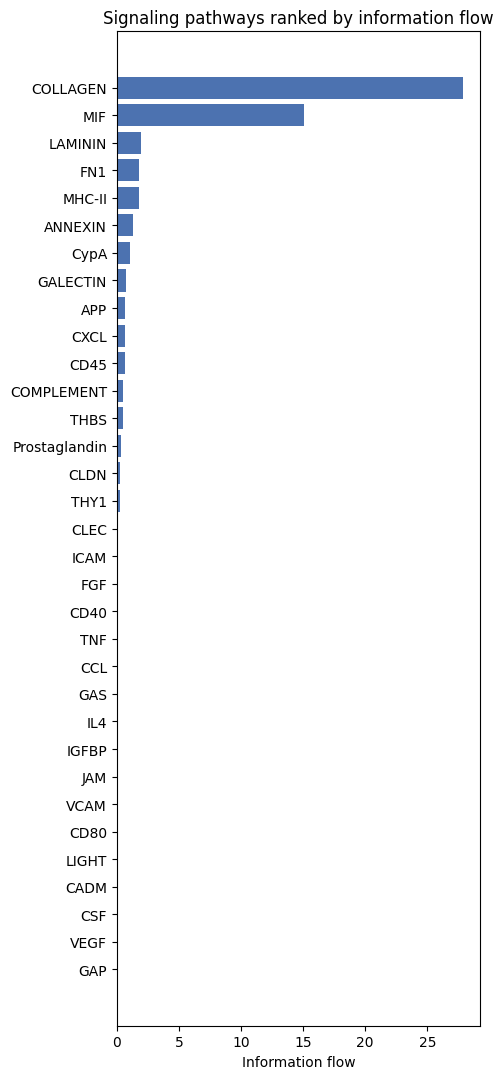
rank_net() ranks pathways by total communication probability (overall information flow).
[6]:
ranking = cc.rank_net()
print(ranking.head(10).to_string(index=False))
ix.plot_rank_net(ranking, title="Signaling pathways ranked by information flow")
pathway_name      flow
    COLLAGEN 27.853288
         MIF 15.083548
     LAMININ  1.929232
         FN1  1.818125
      MHC-II  1.775536
     ANNEXIN  1.264973
        CypA  1.028718
    GALECTIN  0.737726
         APP  0.690152
        CXCL  0.650261
[6]:
4. Zoom into one signaling pathway
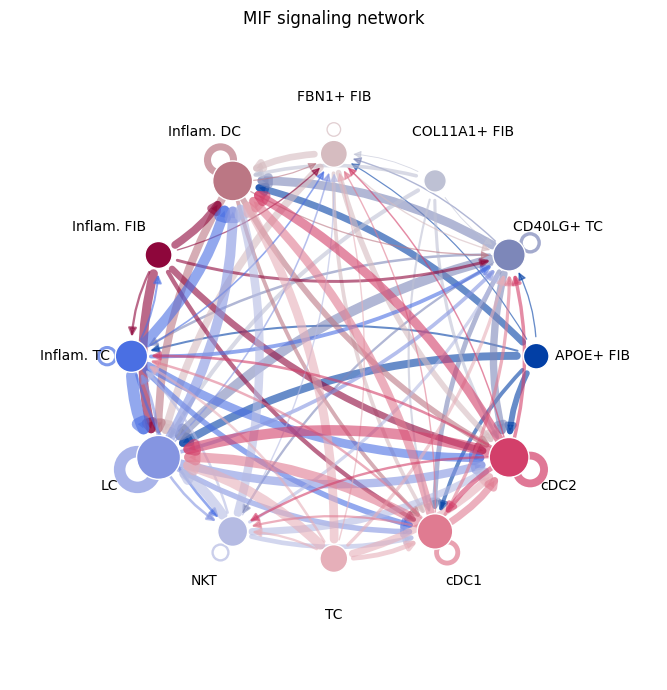
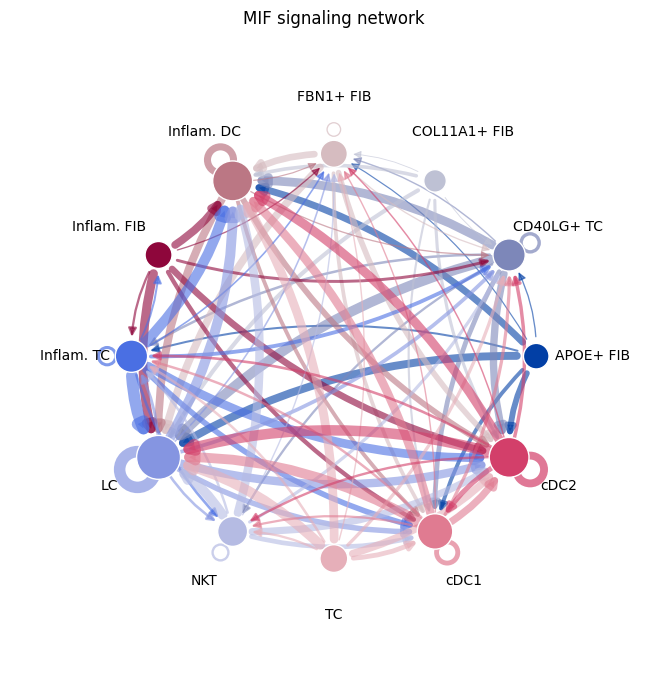
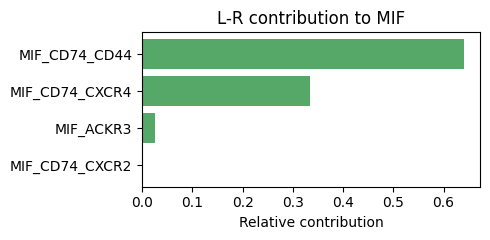
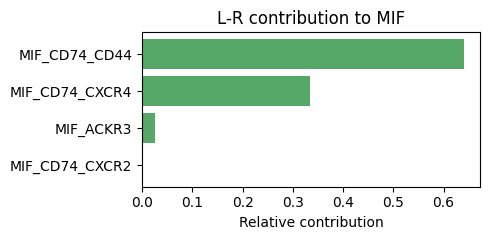
MIF is among the top pathways here. plot_aggregate draws the group-level network for a single pathway; contribution breaks the pathway down into its individual L-R pairs.
[7]:
PATHWAY = "MIF"
ix.plot_aggregate(cc, signaling=PATHWAY, layout="circle",
                  title=f"{PATHWAY} signaling network")
[7]:
[8]:
contrib = cc.contribution(PATHWAY)
ix.plot_contribution(contrib, title=f"L-R contribution to {PATHWAY}")
[8]:
5. Ligand–receptor bubble plot
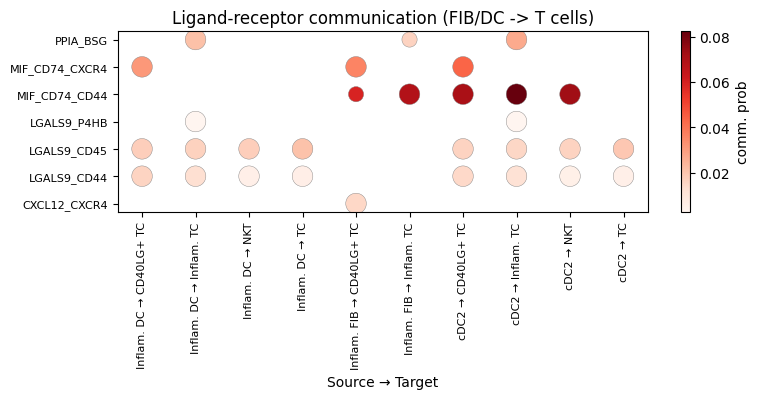
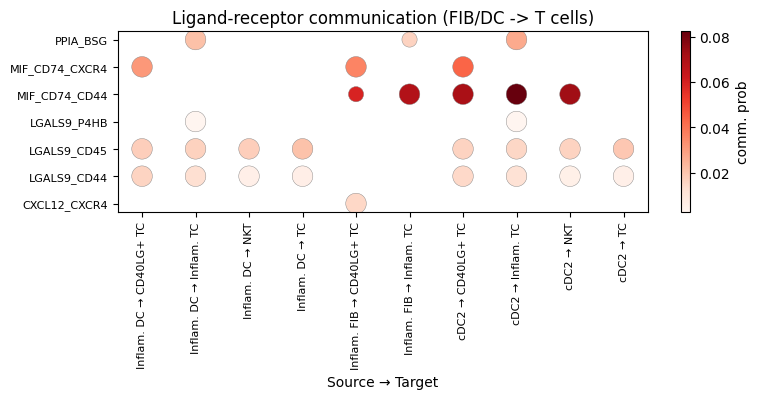
subset_communication returns the significant LR-level table; filter by sources/targets and show the probabilities as a bubble plot. Here: signaling from the inflammatory fibroblast and DC populations to the T-cell populations.
[9]:
sources = ["Inflam. FIB", "Inflam. DC", "cDC2"]
targets = ["TC", "Inflam. TC", "CD40LG+ TC", "NKT"]
comm = cc.subset_communication(sources=sources, targets=targets)
print(f"{len(comm)} significant L-R links")
ix.plot_bubble(comm.head(30), title="Ligand-receptor communication (FIB/DC -> T cells)")
85 significant L-R links
[9]:
6. Signaling roles — network centrality
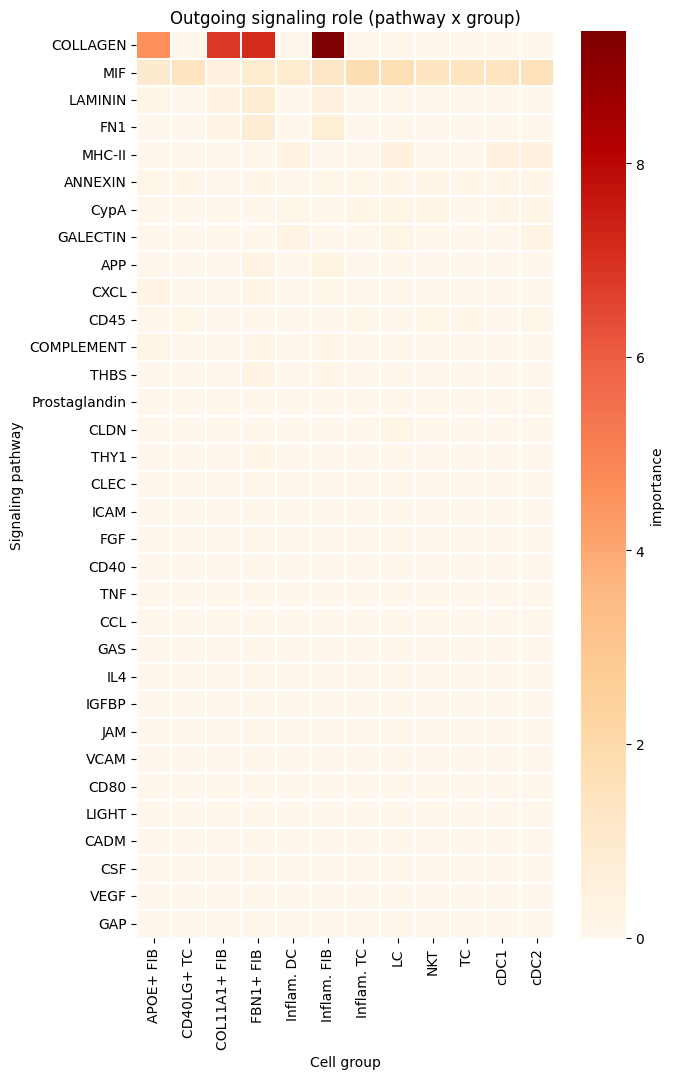
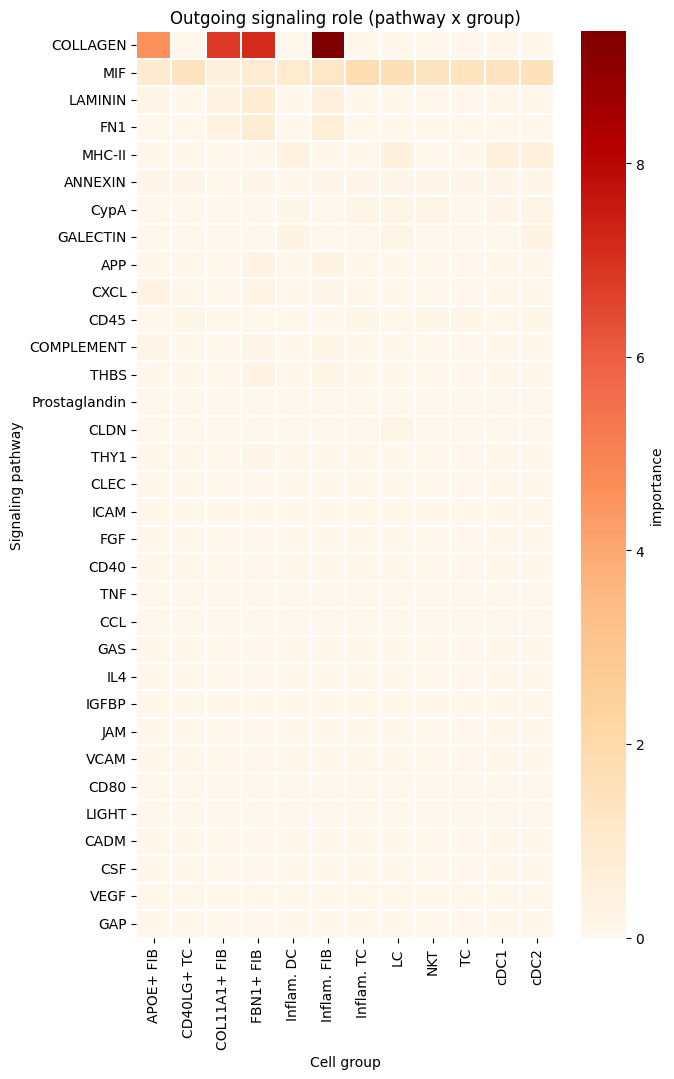
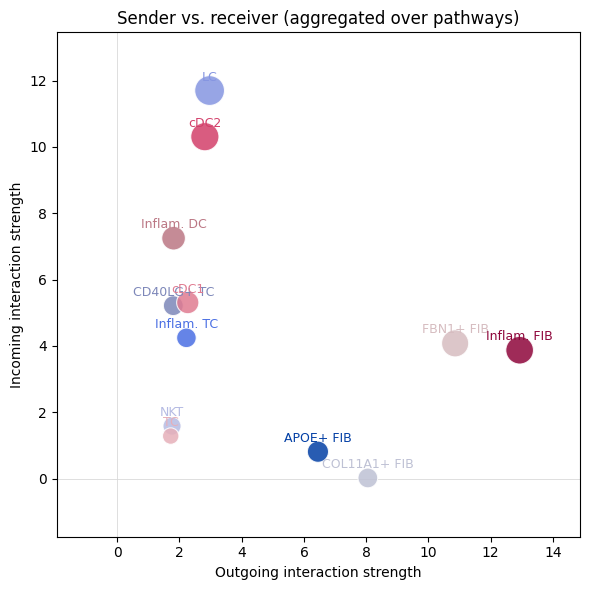
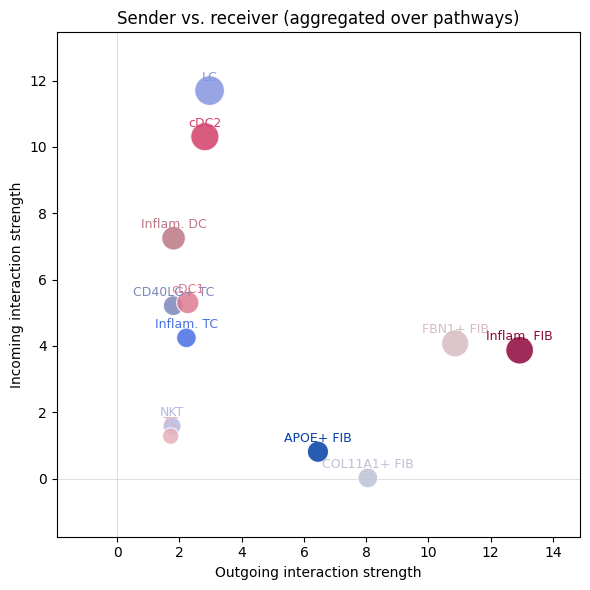
Which cell groups act as dominant senders, receivers, mediators, or influencers? signaling_role_pathway gives a pathway × group role matrix (heatmap), and plot_signaling_role_scatter places each group on a sender vs. receiver plane.
[10]:
role_out = ix.signaling_role_pathway(cc, pattern="outgoing")
ix.plot_signaling_role_heatmap(role_out, title="Outgoing signaling role (pathway x group)")
[10]:
[11]:
ix.plot_signaling_role_scatter(cc, title="Sender vs. receiver (aggregated over pathways)")
[11]:
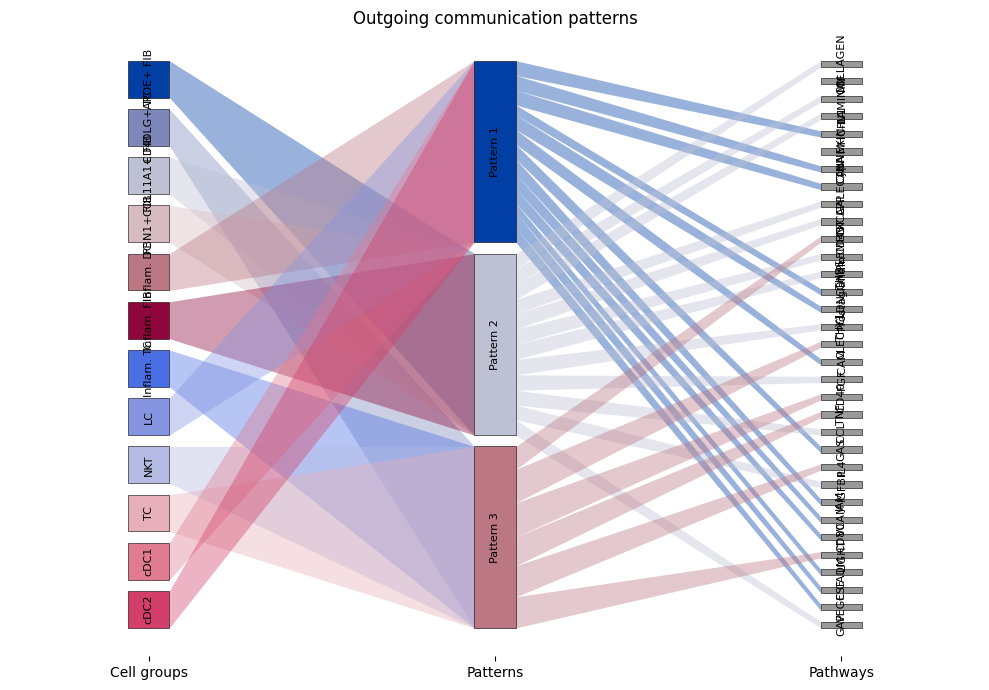
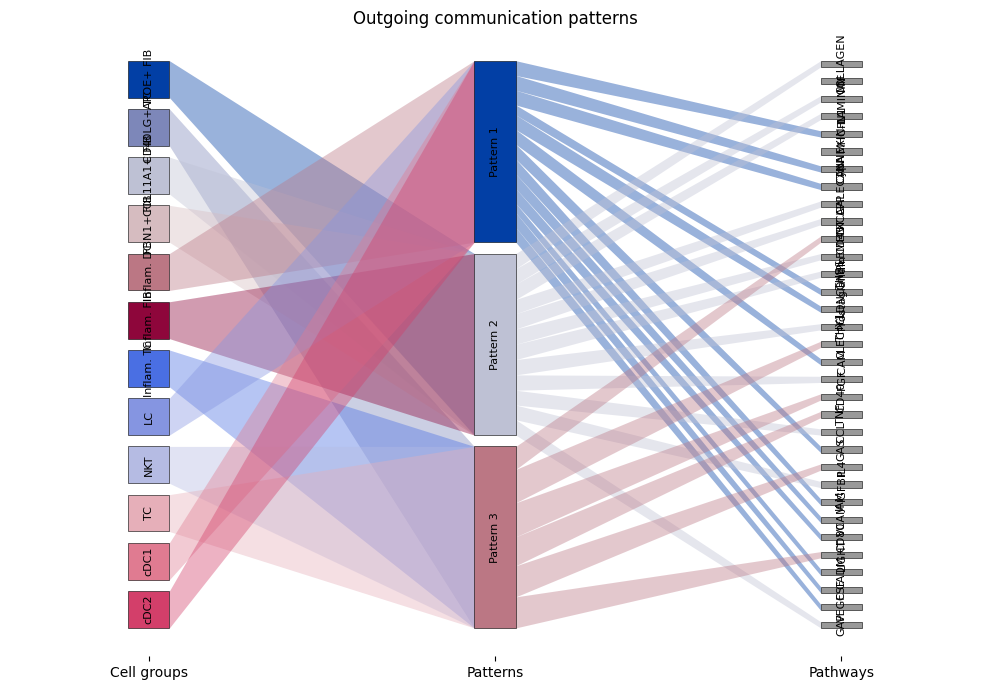
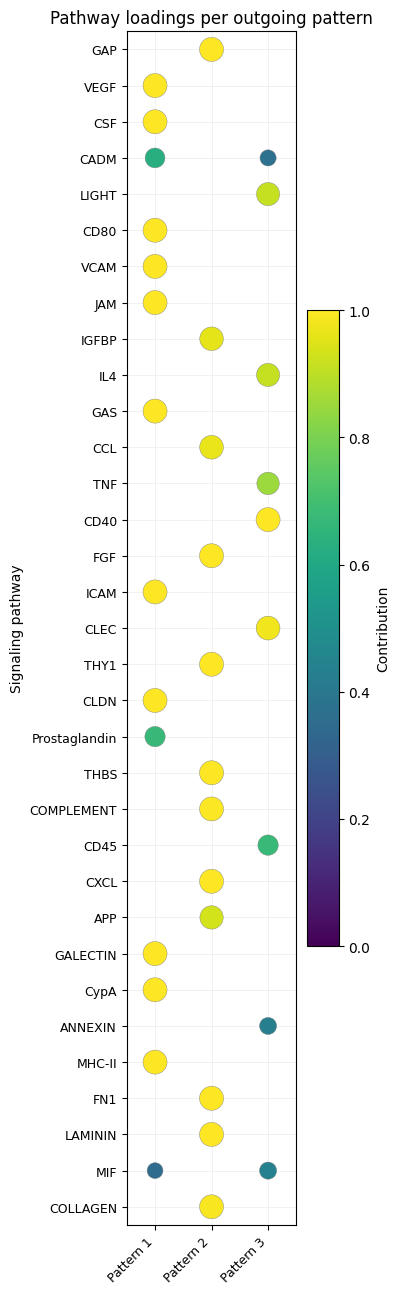
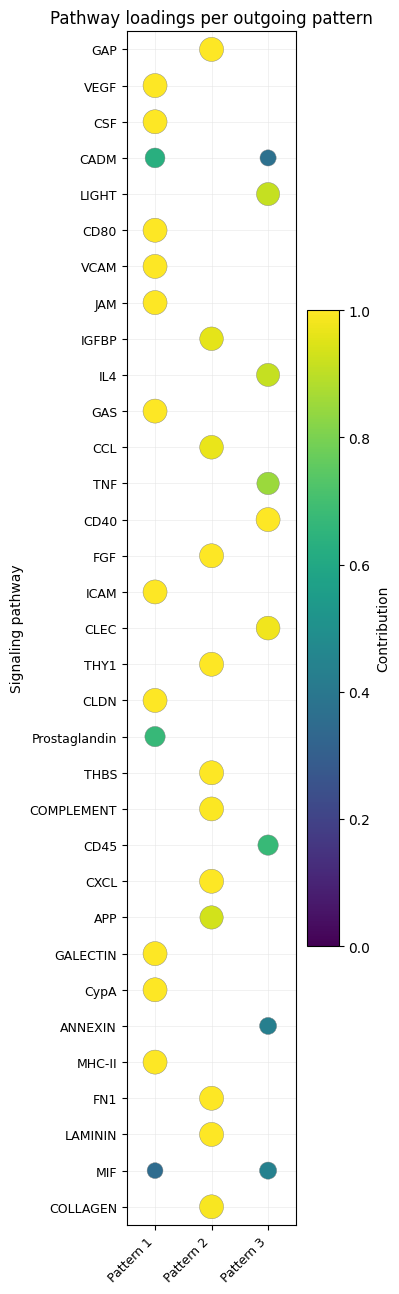
7. Communication patterns (NMF)
Non-negative matrix factorization groups cell populations and pathways into a small number of coordinated communication patterns (CellChat’s identifyCommunicationPatterns). select_k() can help choose the number of patterns; here we use k=3 for the outgoing signaling.
[12]:
cc.identify_communication_patterns(pattern="outgoing", k=3, seed=0, verbose=False)
ix.plot_communication_patterns_river(cc, pattern="outgoing",
                                     title="Outgoing communication patterns")
[12]:
[13]:
ix.plot_communication_patterns_dot(cc, pattern="outgoing", axis="signaling",
                                   title="Pathway loadings per outgoing pattern")
[13]:
8. Pathway similarity manifold
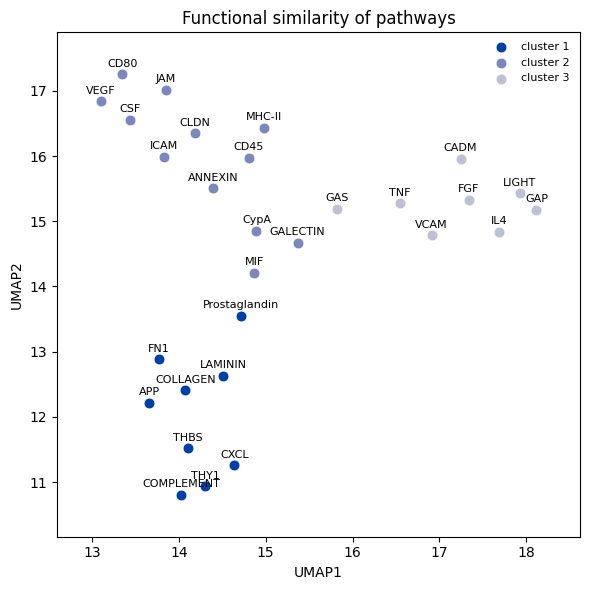
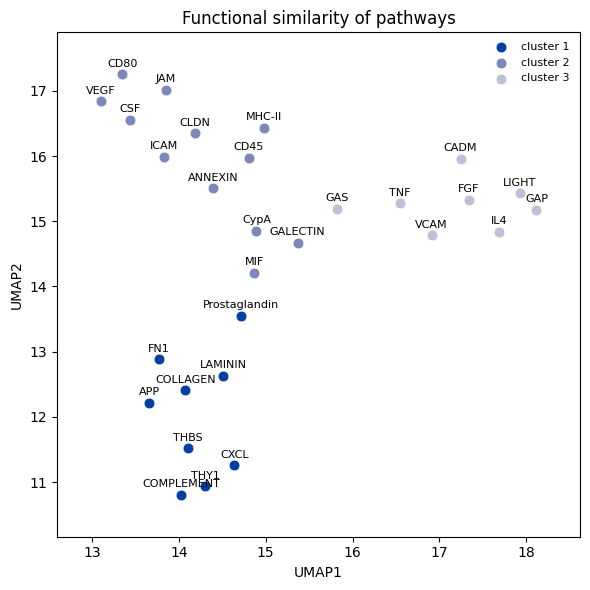
Embed the signaling-pathway networks by functional similarity, then cluster them — pathways that act on similar sender/receiver structure group together (CellChat’s computeNetSimilarity / netEmbedding / netClustering).
[14]:
cc.compute_net_similarity(type="functional")
cc.net_embedding(type="functional", seed=42)
cc.net_clustering(type="functional")
ix.plot_net_embedding(cc, type="functional", title="Functional similarity of pathways")
[interaction] computing functional pathway similarity (33 pathways, SNN k=7)
[interaction] dropping 4 disconnected pathway(s) before embedding: ['CLEC', 'CD40', 'CCL', 'IGFBP']
/home/smcheong/.local/lib/python3.11/site-packages/tqdm/auto.py:21: TqdmWarning: IProgress not found. Please update jupyter and ipywidgets. See https://ipywidgets.readthedocs.io/en/stable/user_install.html
  from .autonotebook import tqdm as notebook_tqdm
/home/smcheong/.local/lib/python3.11/site-packages/umap/umap_.py:1952: UserWarning: n_jobs value 1 overridden to 1 by setting random_state. Use no seed for parallelism.
  warn(
[interaction] embedded 29 pathways (functional) via UMAP
[interaction] inferred number of pathway clusters: k=3
[interaction] clustered 29 pathways into 3 group(s) (kmeans, functional)
[14]:
References
Jin, S. et al. Inference and analysis of cell–cell communication using CellChat. Nat. Commun. 12, 1088 (2021).
CellChat: https://github.com/jinworks/CellChat
sceleto.interaction is a Python port of CellChat (GPL-3.0); please cite the paper above.