Markers Tutorial
[1]:
import warnings
warnings.filterwarnings("ignore")

import scanpy as sc
import sceleto as scl
import matplotlib.pyplot as plt

sc.settings.set_figure_params(facecolor='white', frameon=False)
[2]:
adata = sc.read("/nfs3/SCMGL/smc03_sceleto/PANGEA_T&NK_v03_final.h5ad") # Load T&NK AnnData
[3]:
adata.X
[3]:
<Compressed Sparse Row sparse matrix of dtype 'float32'
        with 133978055 stored elements and shape (93531, 36601)>
[4]:
print(adata.X.min(), adata.X.max())
0.0 8.099076
Marker Discovery
[5]:
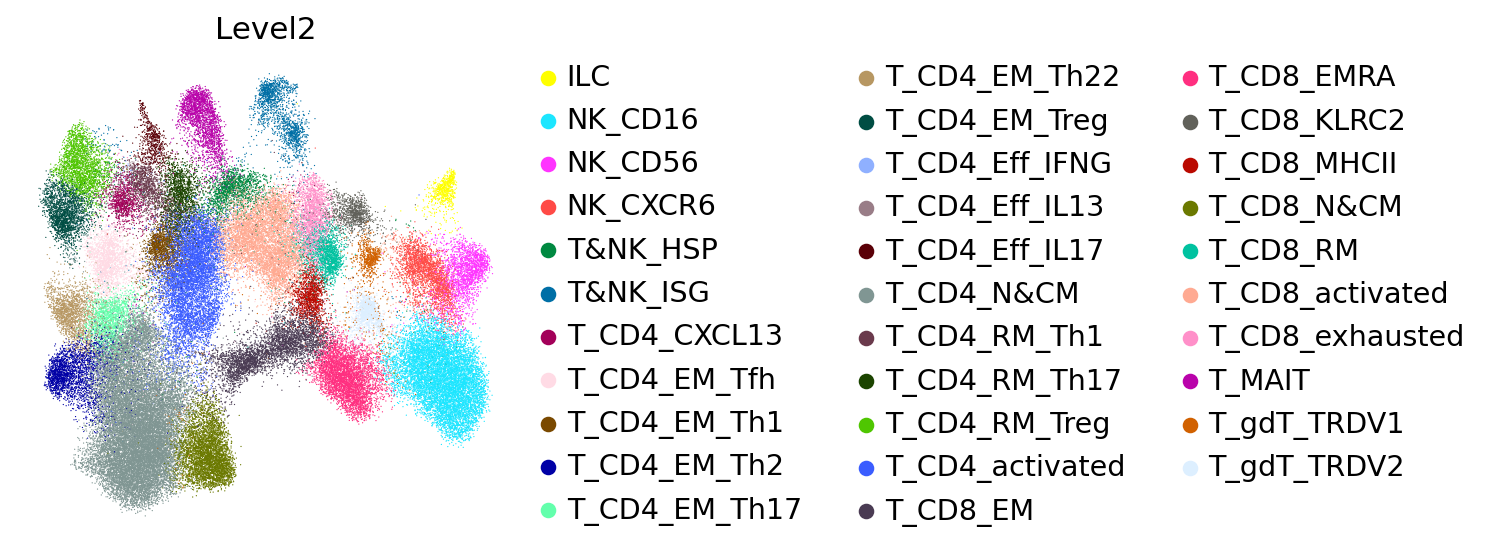
scl.us(adata, 'Level2')
Run graph-based marker detection
[6]:
mk = scl.markers.marker(adata, "Level2")
Auto thres_fc: 1.94
Top marker genes per group as a dictionary
[7]:
mk.markers.keys()
[7]:
dict_keys(['ILC', 'NK_CD16', 'NK_CD56', 'NK_CXCR6', 'T&NK_HSP', 'T&NK_ISG', 'T_CD4_CXCL13', 'T_CD4_EM_Tfh', 'T_CD4_EM_Th1', 'T_CD4_EM_Th2', 'T_CD4_EM_Th17', 'T_CD4_EM_Th22', 'T_CD4_EM_Treg', 'T_CD4_Eff_IFNG', 'T_CD4_Eff_IL13', 'T_CD4_Eff_IL17', 'T_CD4_N&CM', 'T_CD4_RM_Th1', 'T_CD4_RM_Th17', 'T_CD4_RM_Treg', 'T_CD4_activated', 'T_CD8_EM', 'T_CD8_EMRA', 'T_CD8_KLRC2', 'T_CD8_MHCII', 'T_CD8_N&CM', 'T_CD8_RM', 'T_CD8_activated', 'T_CD8_exhausted', 'T_MAIT', 'T_gdT_TRDV1', 'T_gdT_TRDV2'])
Top marker genes per group as a dictionary
[8]:
mk.markers['ILC'][:10]
[8]:
['IL1R1',
 'KIT',
 'TNFSF11',
 'SPINK2',
 'AFF3',
 'IL23R',
 'KRT86',
 'KRT81',
 'LST1',
 'RAMP1']
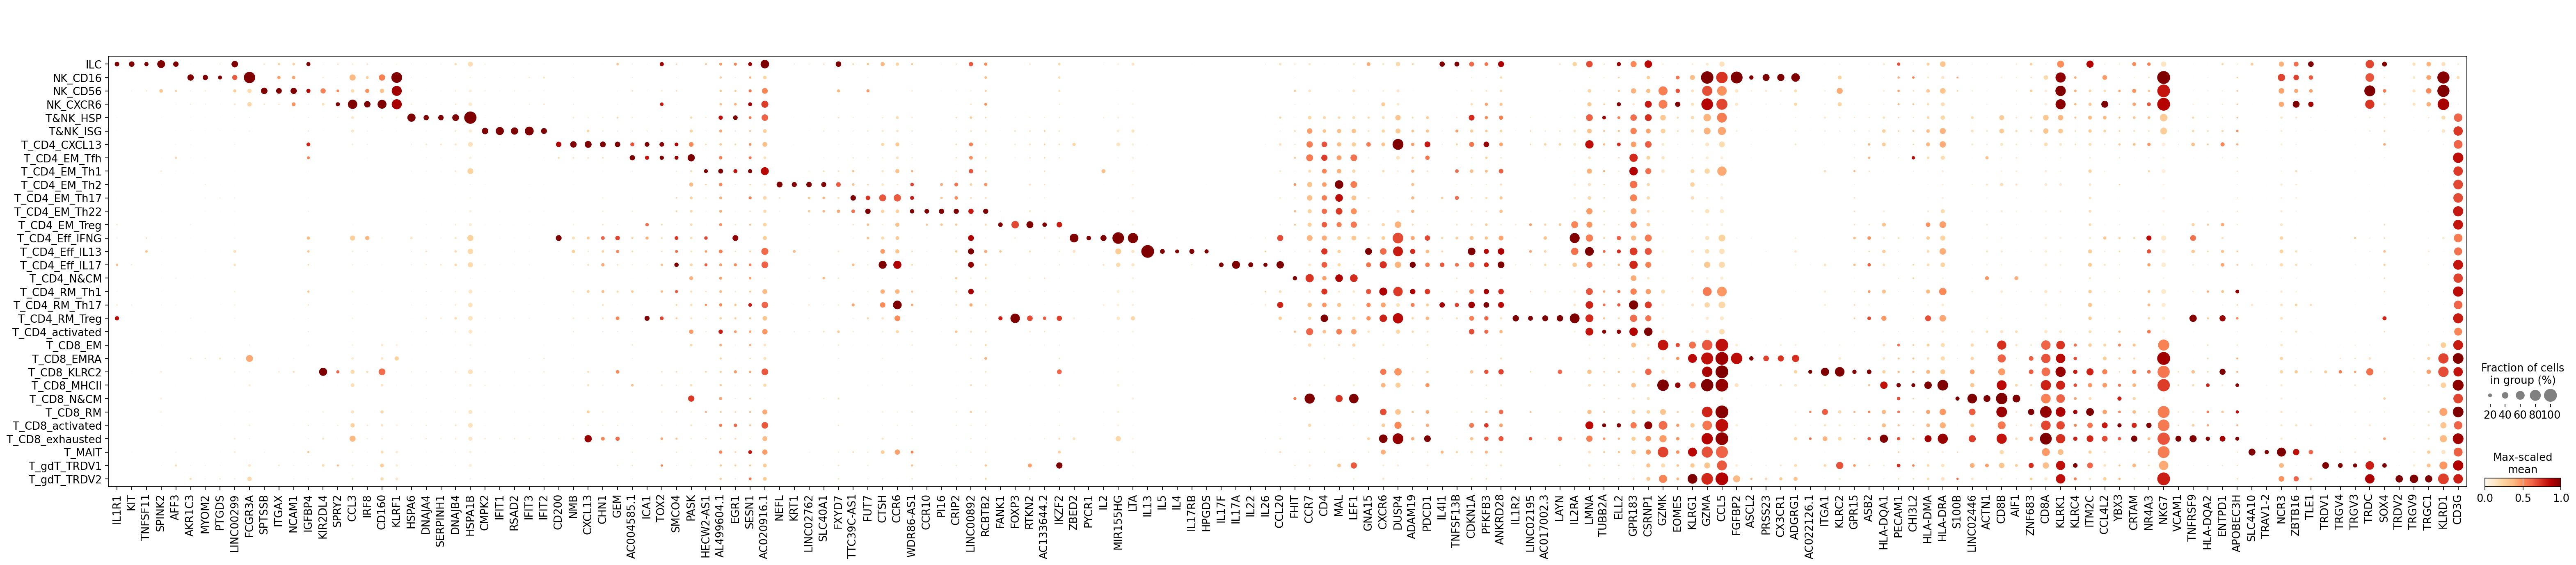
Dotplot of top 5 markers per cell type
[9]:
mk.plot(n_top=5)
Dotplot
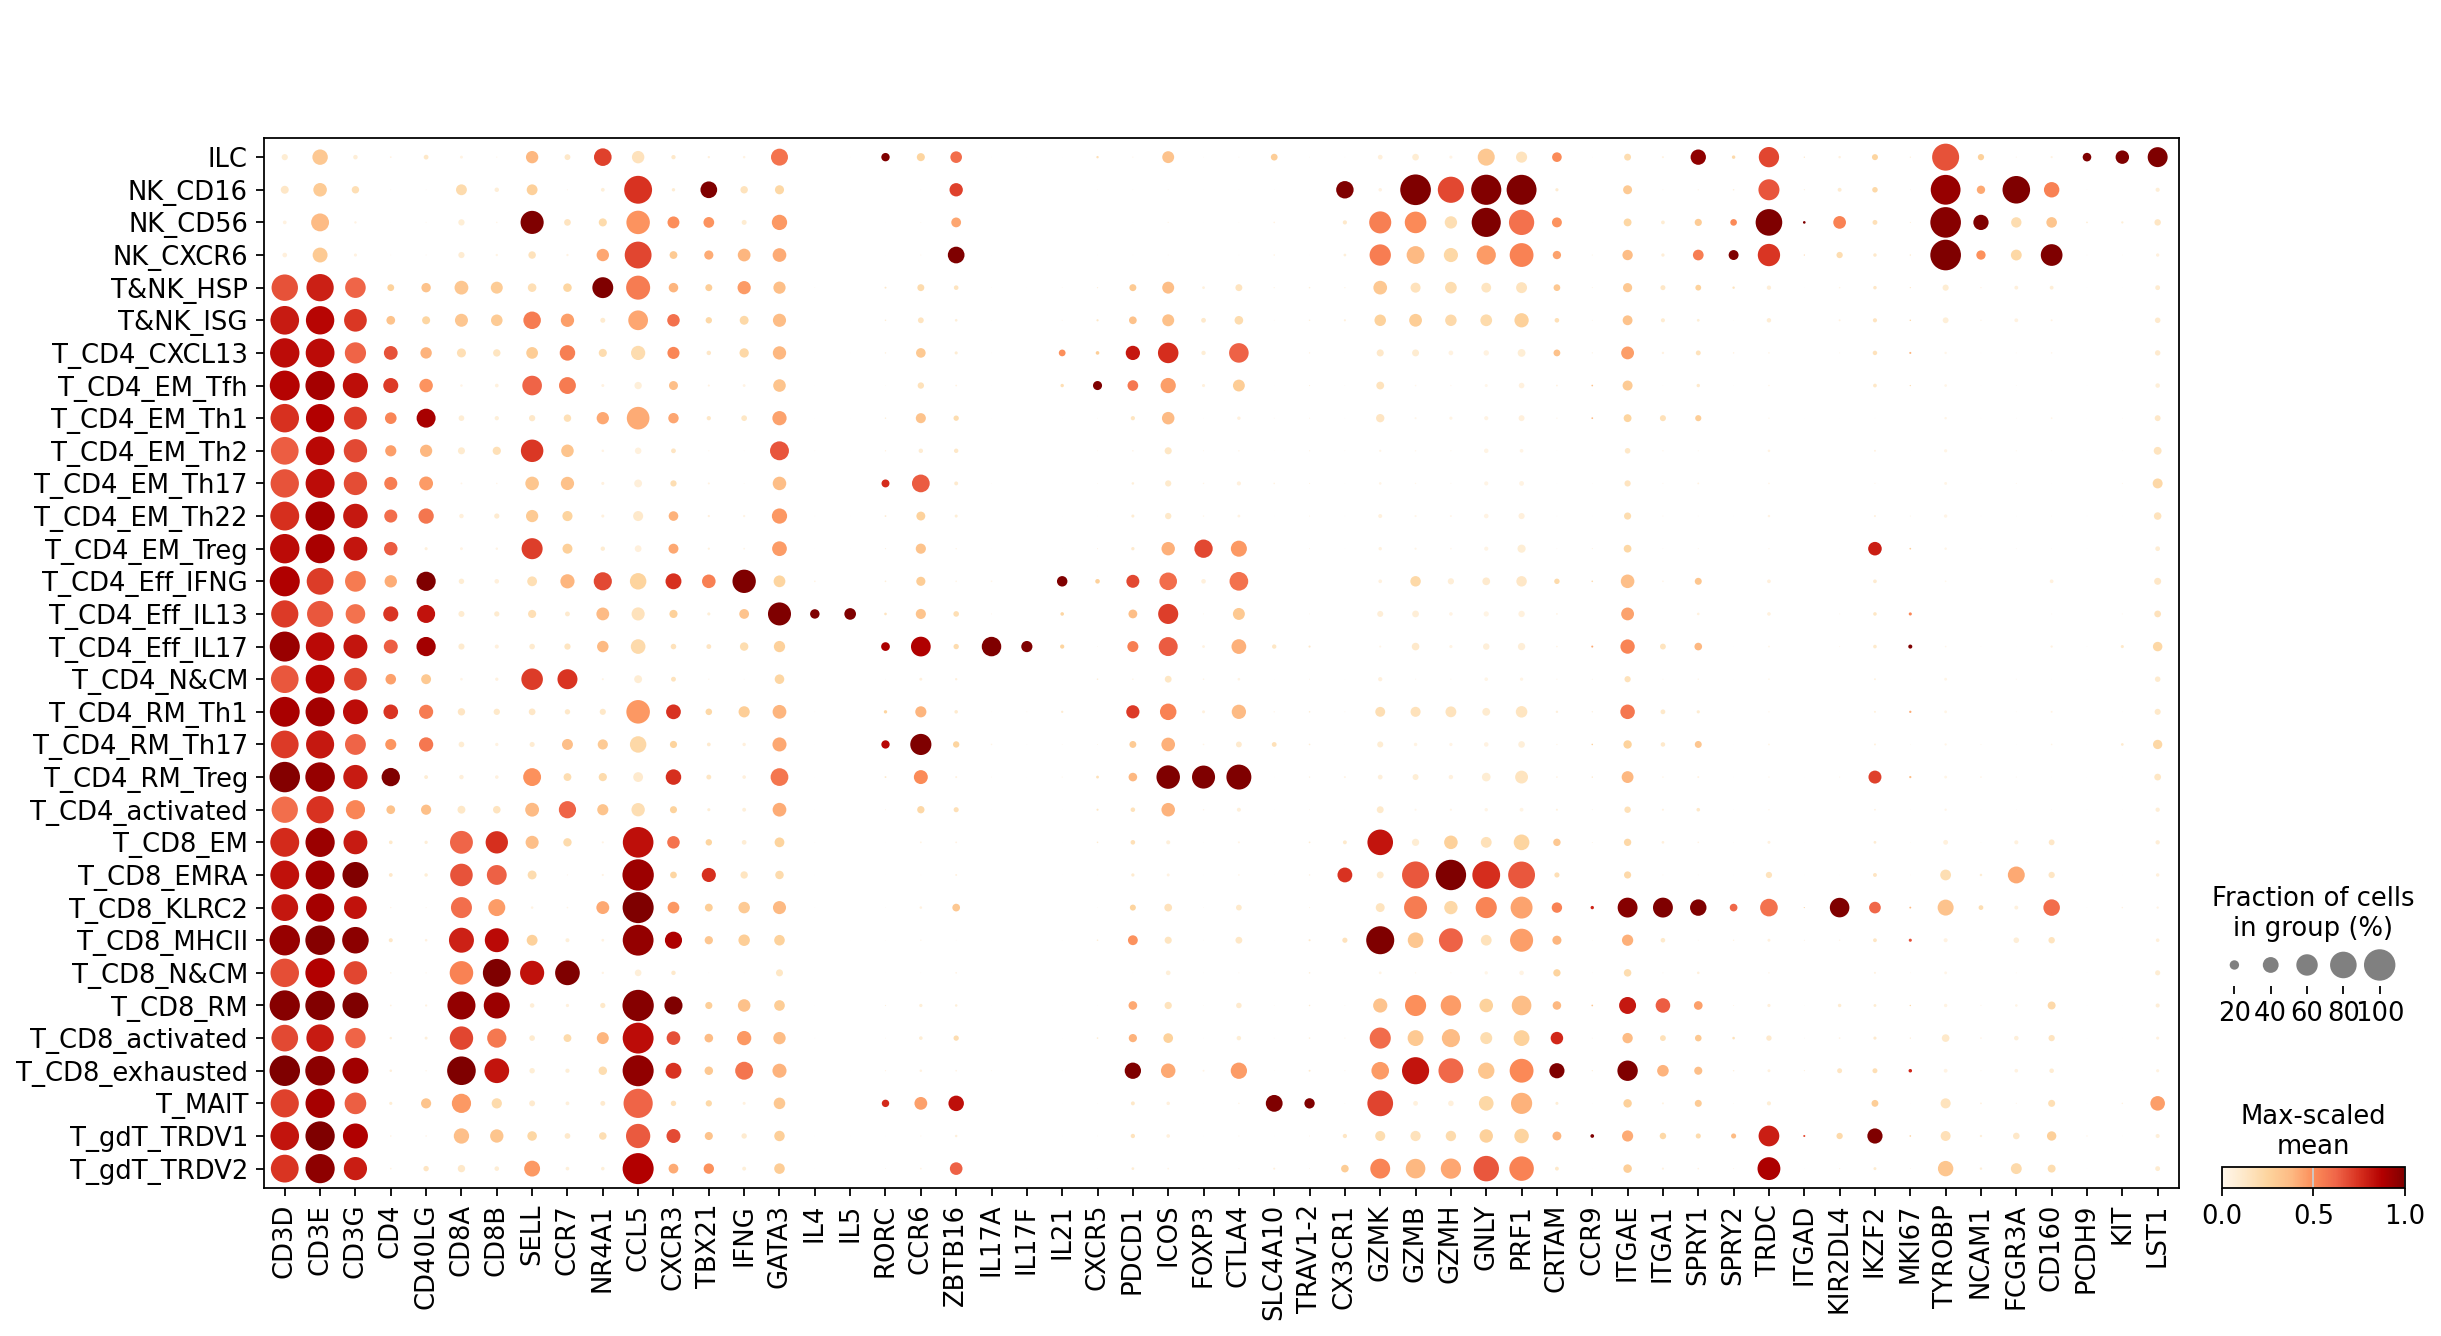
Pass a flat gene list to visualize any genes of interest
[10]:
celltypist_tnk = 'CD3D,CD3E,CD3G,CD4,CD40LG,CD8A,CD8B,SELL,CCR7,NR4A1,CCL5,CXCR3,TBX21,IFNG,GATA3,IL4,IL5,RORC,CCR6,ZBTB16,IL17A,IL17F,IL21,CXCR5,PDCD1,ICOS'.split(',')
celltypist_tnk += 'FOXP3,CTLA4,SLC4A10,TRAV1-2,CX3CR1,GZMK,GZMB,GZMH,GNLY,PRF1,CRTAM,CCR9,ITGAE,ITGA1,SPRY1,SPRY2,TRDC'.split(',')
celltypist_tnk += 'ITGAD,KIR2DL4,IKZF2,MKI67,TYROBP,NCAM1,FCGR3A,CD160,PCDH9,KIT,LST1'.split(',')

scl.dotplot(adata, celltypist_tnk, groupby='Level2')
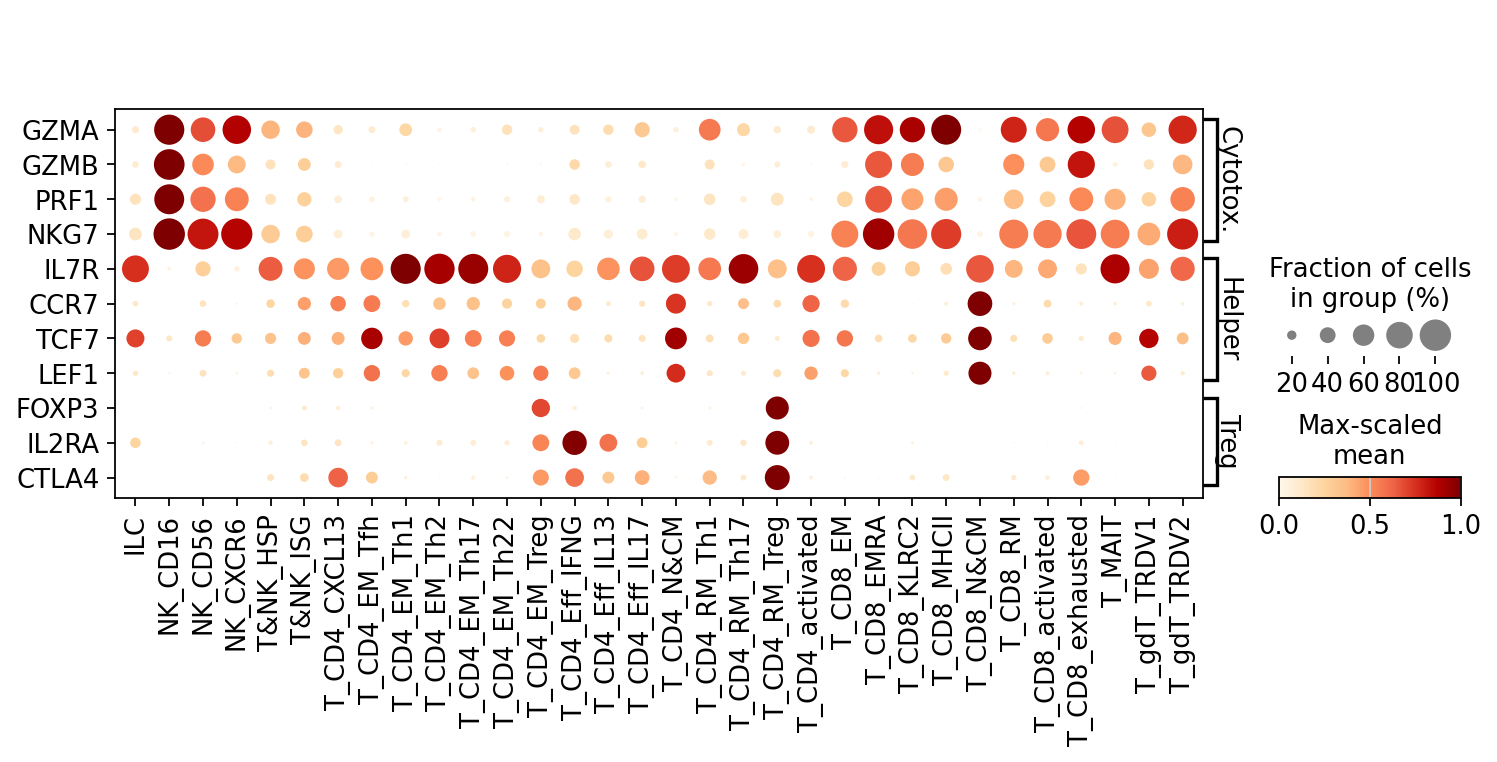
Pass a dict to group genes by functional category on the axis
[11]:
gene_dict = {
    "Cytotoxic": ["GZMA", "GZMB", "PRF1", "NKG7"],
    "Helper":    ["IL7R", "CCR7", "TCF7", "LEF1"],
    "Treg":      ["FOXP3", "IL2RA", "CTLA4"],
}

scl.dotplot(adata, gene_dict, groupby="Level2", swap_axes=True)
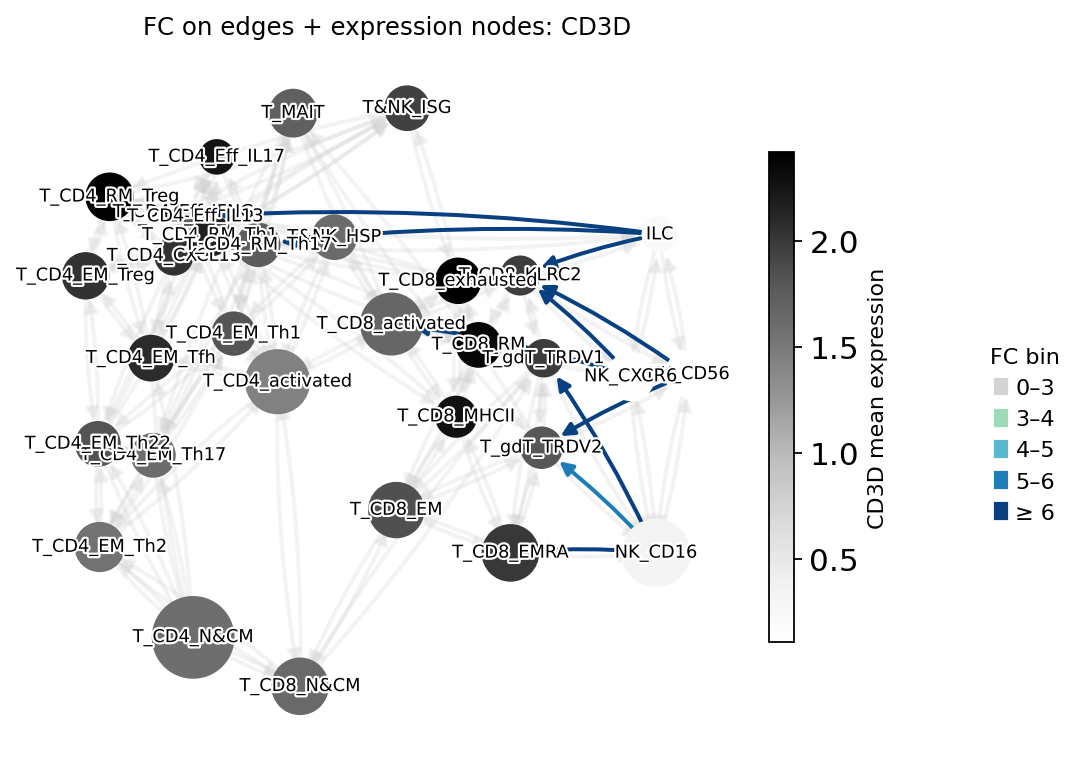
PAGA edge fold-changes for a single gene
[12]:
mk.plot_gene_edges_fc("CD3D", figsize=(7, 5))
plt.show()
Hierarchy
Run markers at three Leiden resolutions
[13]:
levels = ["leiden_1.0", "leiden_2.0", "leiden_4.0"]
marker_runs = {lv: scl.markers.marker(adata, lv) for lv in levels}
  Auto thres_fc: 2.85
  Auto thres_fc: 1.00
  Auto thres_fc: 2.49
Build cross-resolution hierarchy
[14]:
hr = scl.markers.hierarchy(adata, marker_runs.values())
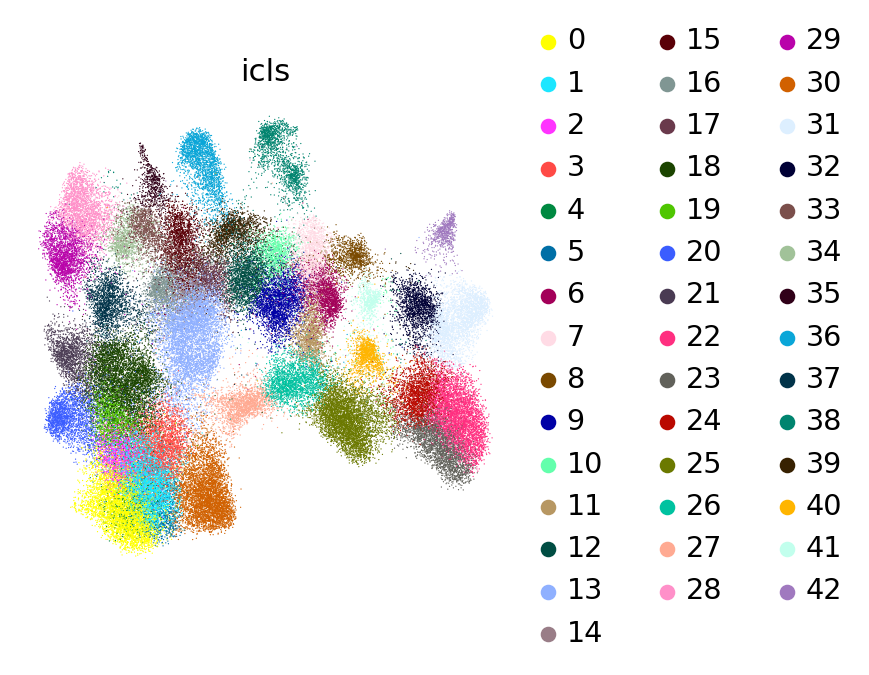
UMAP colored by hierarchical cluster assignment
[15]:
scl.us(adata, 'icls')
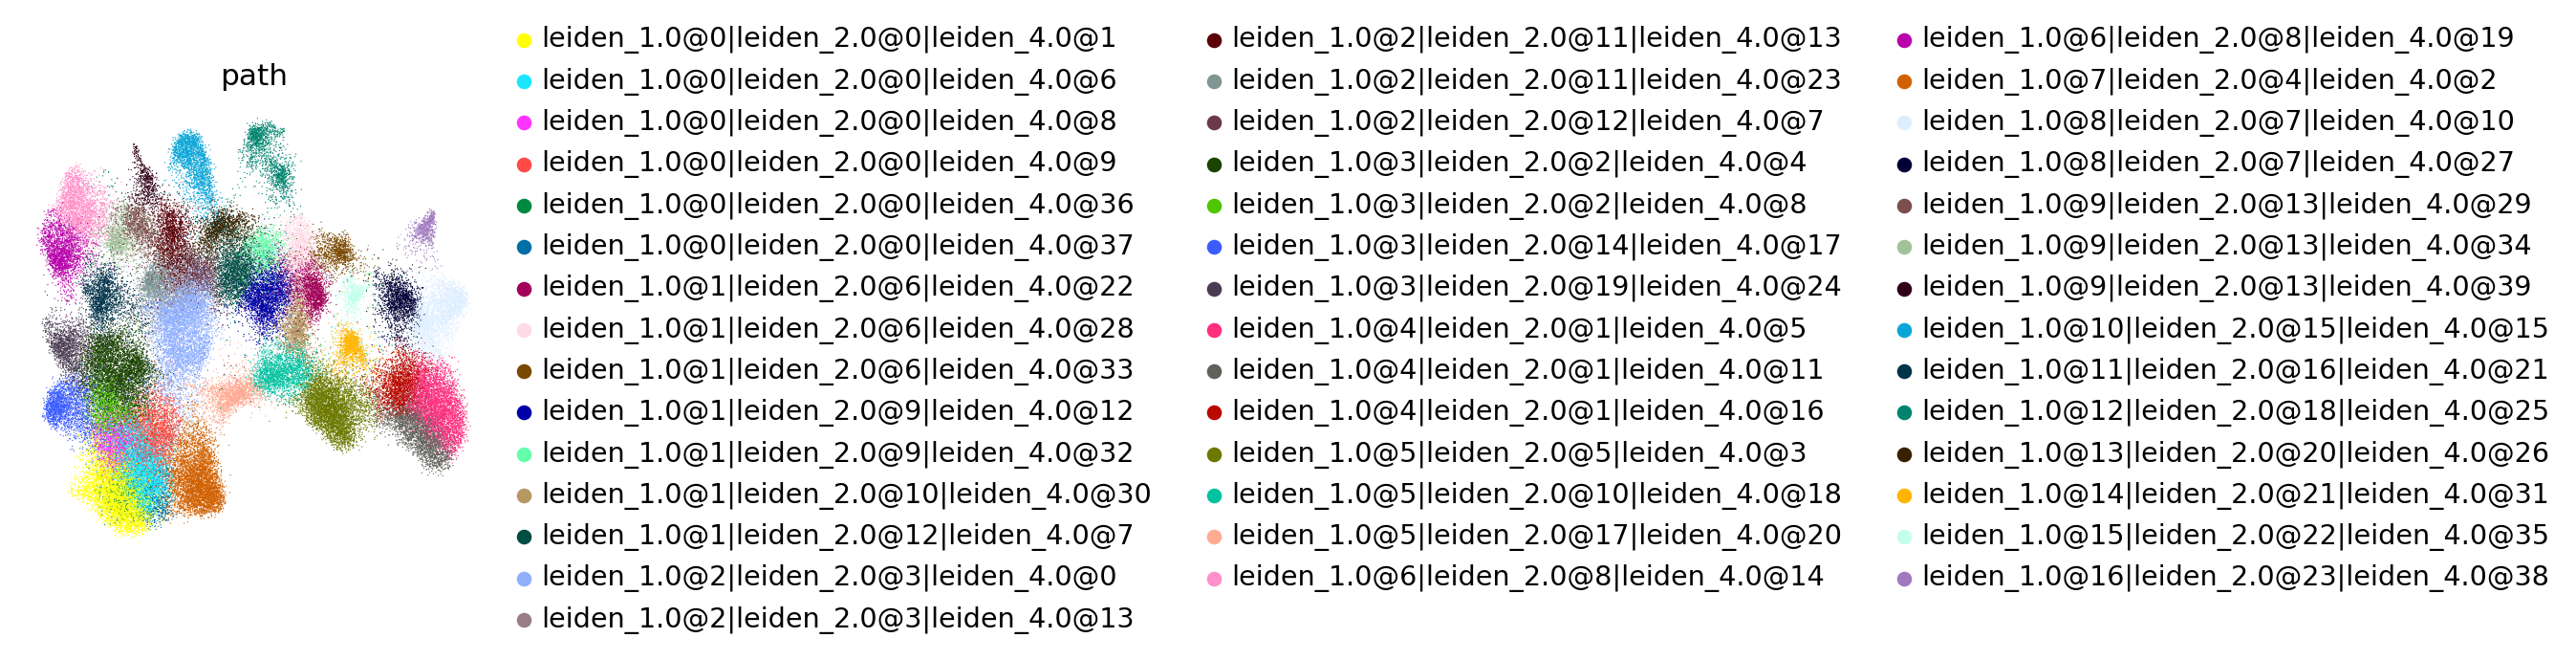
UMAP colored by lineage path
[16]:
scl.us(adata, 'path')
Export interactive HTML viewer
[17]:
hr.interactive_viewer(adata, save="viewer_TNK_hierarchy.html")
Interactive viewer saved → viewer_TNK_hierarchy.html
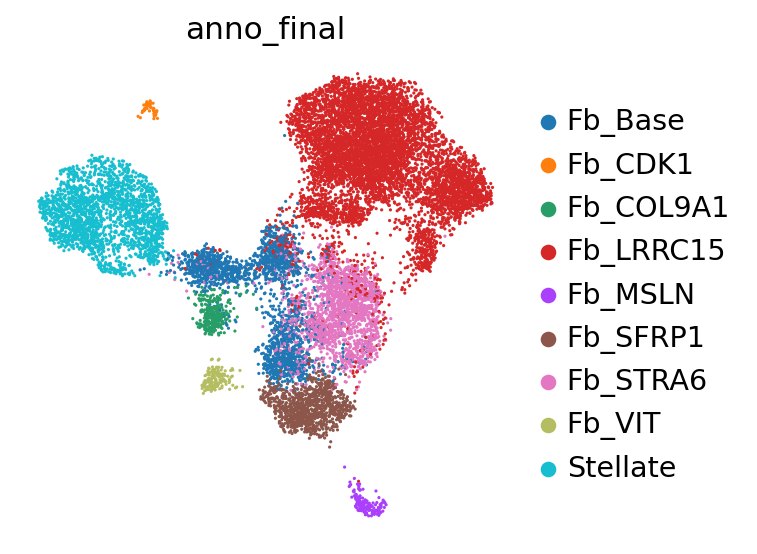
Markers with batch testing
Load fibroblast dataset; ‘Sample’ column holds batch labels
[18]:
fib = sc.read_h5ad("/nfs/SCMGL/srk01_PancCa/16_FIGURE/data/PCI01.v43.fibrawt_final_02.h5ad")
scl.us(fib, 'anno_final')
[19]:
print(fib.X.min(), fib.X.max())
-5.547311 10.0
[20]:
print(fib.raw.to_adata().X.min(), fib.raw.to_adata().X.max())
0.0 10.360901
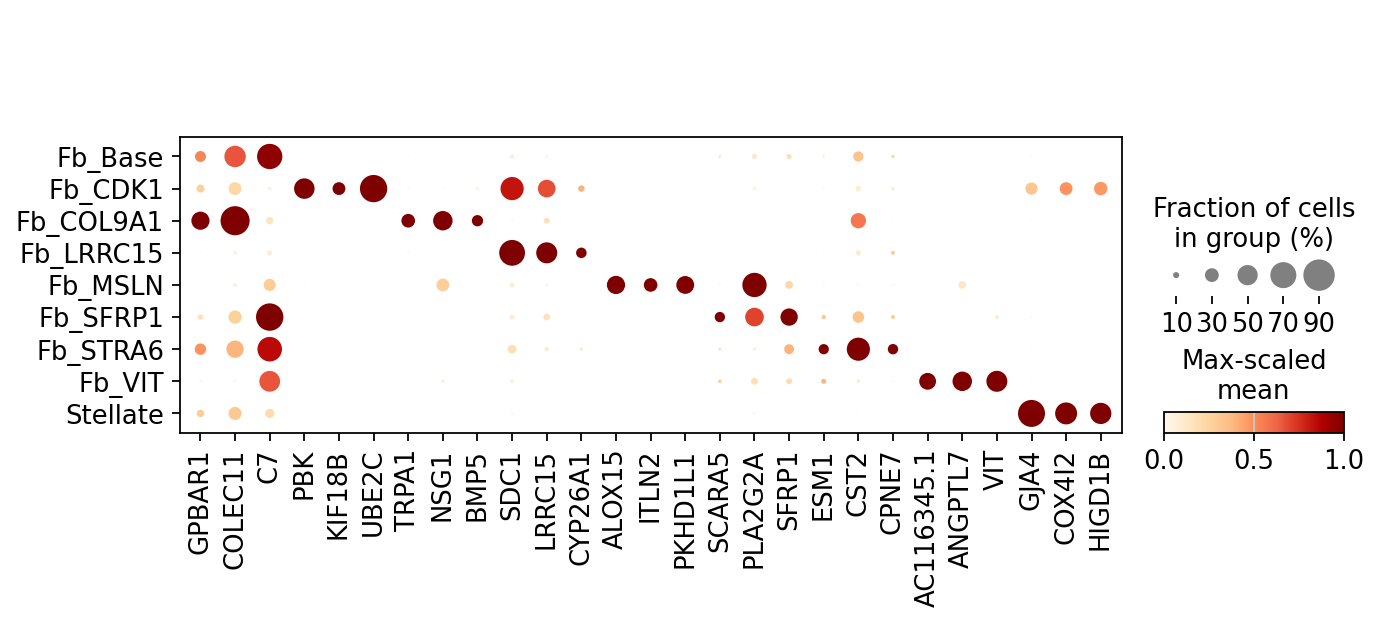
Markers without batch consideration
[21]:
mk_no_batch = scl.markers.marker(fib, "anno_final")
Auto thres_fc: 1.00
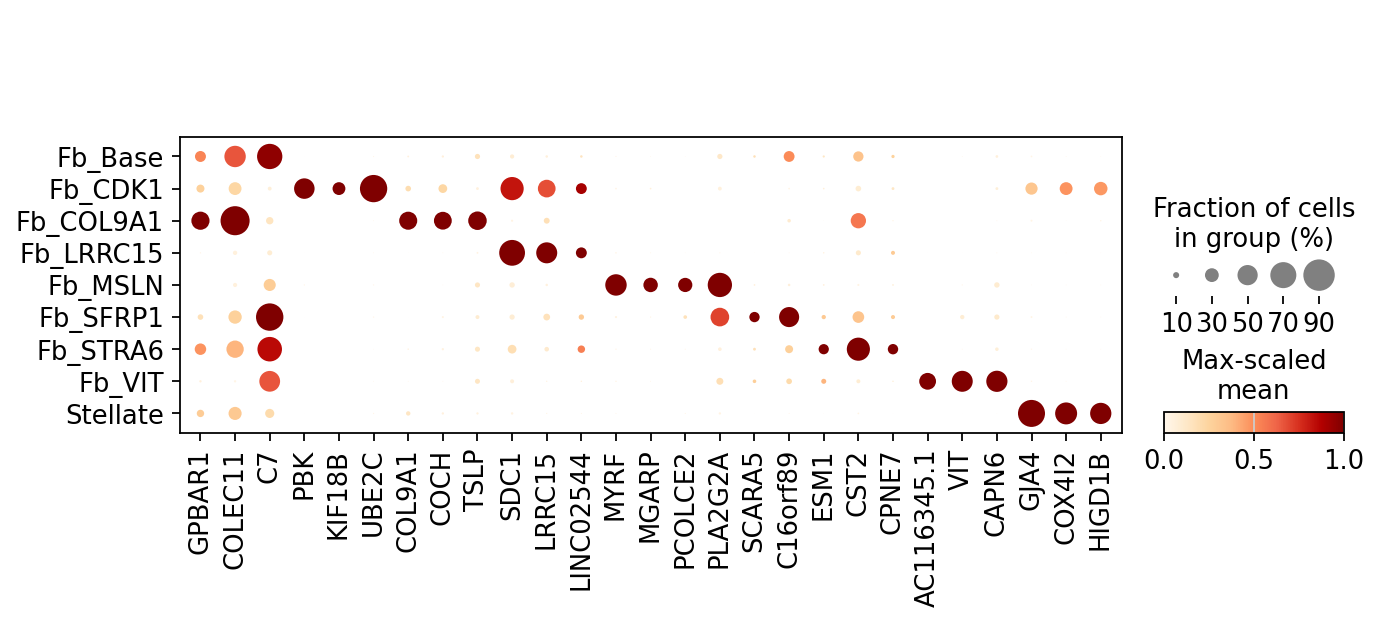
Markers with per-sample t-test filter
[22]:
mk_batch = scl.markers.marker(fib, "anno_final", batch_key="Sample")
Auto thres_fc: 1.00
[23]:
print("Without batch correction")
mk_no_batch.plot(n_top=3)  # Batch-sensitive genes may appear
Without batch correction
[24]:
print("With batch correction")
mk_batch.plot(n_top=3)  # Only genes consistent across samples are retained
With batch correction
Build batch-corrected hierarchy across three resolutions
[25]:
sc.tl.leiden(fib, 0.1, key_added='leiden_0.1')
sc.tl.leiden(fib, 0.5, key_added='leiden_0.5')
sc.tl.leiden(fib, 1.0, key_added='leiden_1.0')
[26]:
fib_levels = ["leiden_0.1", "leiden_0.5", "leiden_1.0"]
fib_runs = {lv: scl.markers.marker(fib, lv, batch_key="Sample") for lv in fib_levels}
hr_fib = scl.markers.hierarchy(fib, fib_runs.values(), batch_key="Sample")
  Auto thres_fc: 1.00
  Auto thres_fc: 1.00
  Auto thres_fc: 1.00
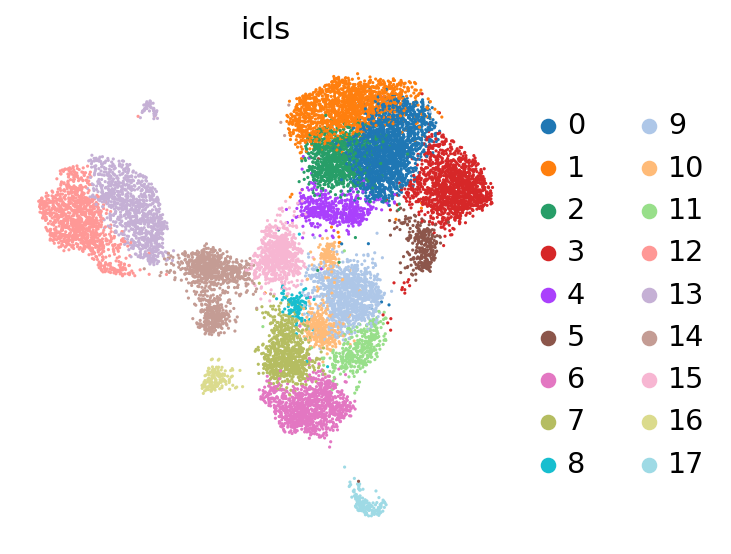
Hierarchical clusters in fibroblast UMAP
[27]:
scl.us(fib, 'icls')
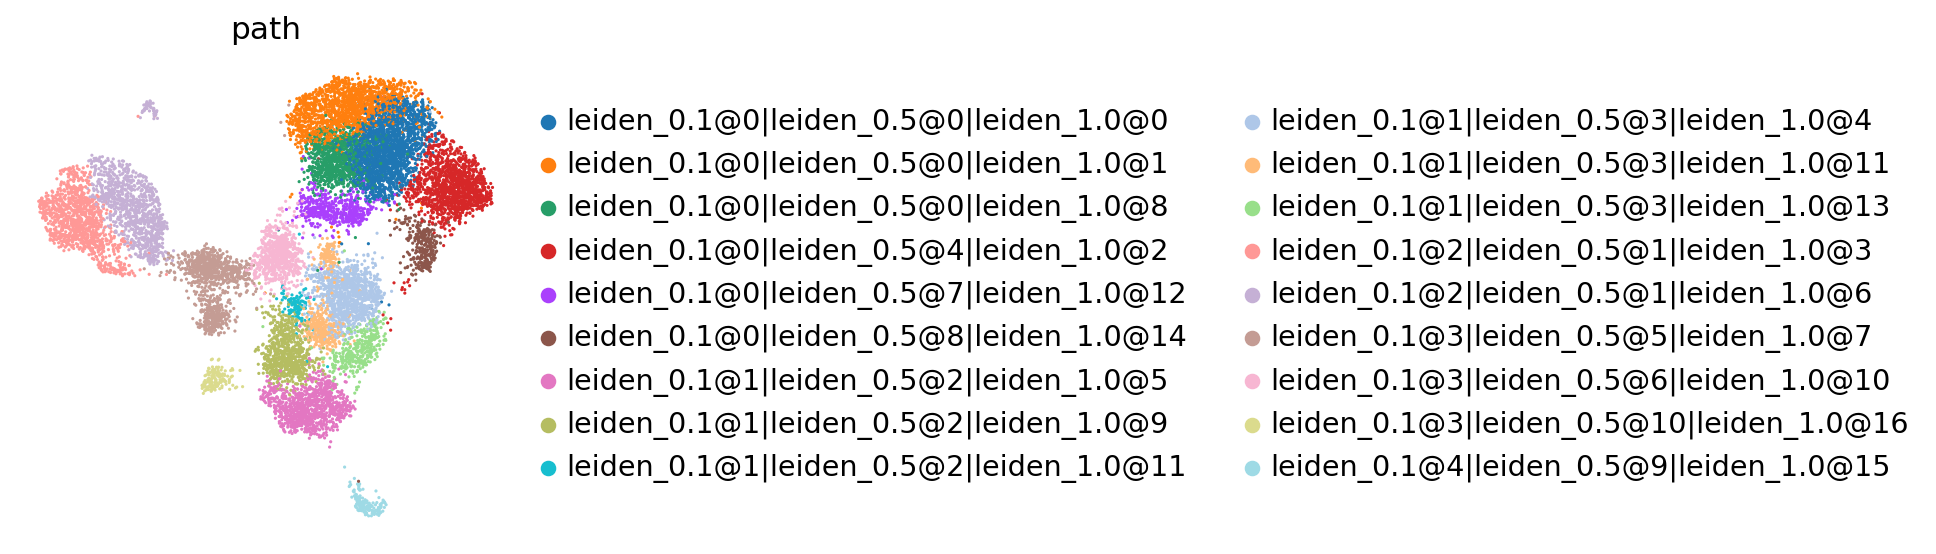
Lineage paths in fibroblast UMAP
[28]:
scl.us(fib, 'path')
Export batch-aware interactive viewer
[29]:
hr_fib.interactive_viewer(fib, save="viewer_fib_batch.html")
Batch interactive viewer saved → viewer_fib_batch.html